Your WorkStation has a Budget Tracking feature that can help you capture basic budgeting information. Please be aware that it does not include the features that a budgeting software program offers. Budget Tracking includes several webparts that work together. Those webparts are discussed below in the order in which they should be populated.
Please review the following information to determine if the Budget Tracking can help you. If you want to add these features to your WorkStation, please contact us by email at toolbox@ku.edu or by phone at 785-864-0533.
Budgets
This webpart allows you to enter information about your revenue sources. You can create fields to match your needs. Editing this webpart is like editing any other custom list.
To create a new entry:
- Click on New to create a new budget entry.
- Enter the budget name, start and end date, amount and check the "Active" box if the budget is currently active.
- NOTE: The budget items will display alphabetically when you create a new budget transaction. If you want the budget items to display in a different order, you will need to number them.
- Click on Save.
- Repeat to create budgets for each revenue source.
- If you expect to receive donations or other sporadic income, create a budget called "Other Income" and enter the total as $0.
Budget Categories
Budget Categories allow you to separate your expenses into categories that you define. Category examples are Administration, Training, Travel, Supplies, etc.
- Click on New to create a new category .
- Enter the budget category and description if needed.
- Click on Save.
- Repeat to create all the categories you need.
Budget Sources
An optional webpart that you can use (and rename as needed) if you need another way to separate out your budget items. If you don't want to use it, you can hide the field in the Budget Transactions library settings.
Budget Transactions
This is where you enter your expenses, or additional income such as donations. By default there are fields for: Budget, Date, Category, Source, Amount and Description. You can add other fields if needed, or remove the Source field if you do not want to use it.
- Click New to create a new budget transaction.
- Select the Budget, Date, and Category for your entry.
- In the Amount field, you do not need to enter dollar signs, or cents (.00) if the amount is a whole dollar.
- If you are recording an expense, put a minus sign before the amount, e.g. "-150.45."
- If you are recording income, enter the amount, e.g., "500."
- Click Save.
- Repeat if you need to enter additional budget transactions.
If you want to add a date range filter to the Budget Transactions page, please contact us
toolbox@ku.edu or 785-864-0533. We will have to submit a request to our vendor to create this for you.
Budget Reports
This webpart provides the ability to view combined budgets and expenditures, or to view each budget separately. By default you will see all your budgets and the combined totals spent and remaining. If you want to see only one budget or category you need to use filters.
- Click Show Filters.
- Select the date range, budget, category and/or source that you want to view.
- Click the Filter Graph button to see the items you have selected.
- If you want to return to the combined view, or select another filtered view, click the Clear All Filters button.
Budget Graphs
You can create simple graphs to show how your money is being spent. The income listed in the Budgets webpart is not displayed, only the expenditures and income that are added through budget transactions. You can change the type of graph by following these instructions:
- Go to the page that displays all the budget webparts.
- Click on the gear in the upper right and select Edit Page from the dropdown menu.
- Hover over Budget Graph webpart title, click on the small down arrow to the right, and select Edit the Webpart.
- Click the plus sign to the left of Budget Graph Settings to view these options.
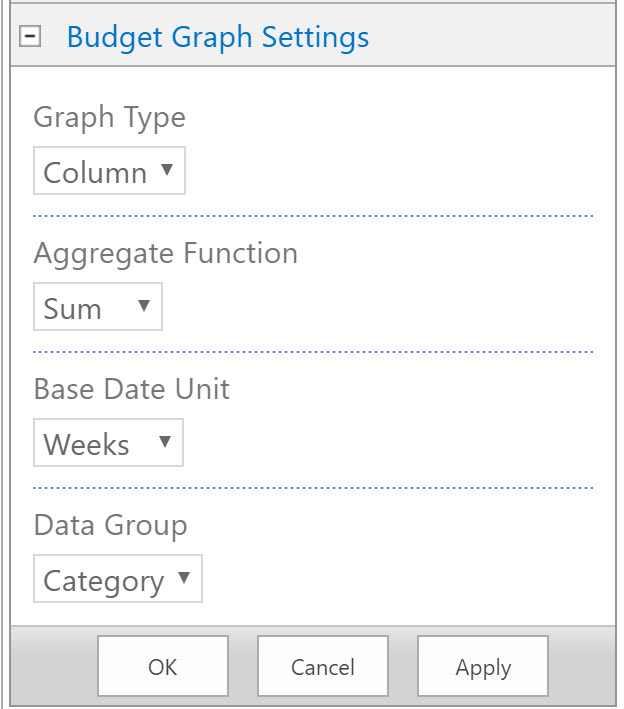
- Select the Graph Type you want: bar, column, line or pie.
- Select the Aggregate Function: max, min, sum average or count.
- Select the Base Date Unit: days, weeks, months or years.
- Select the Data Group: budget, category or source.
- Click OK to save.
By default you will see all your budgets combined on one graph. If you want to see only one budget or category you need to use filters. To filter a graph:
- Click Show Filters.
- Select the date range, budget, category and/or source that you want to view.
- Click the Filter Graph button to see the items you have selected.
- If you want to return to the combined view, or select another filtered view, click the Clear All Filters button.